Observability#
A self-hosted BSR ships with downloadable Prometheus alerting and recording rules and Grafana dashboards that surface its overall health, error budget, and per-endpoint latency. This page is for the platform engineers who run the BSR cluster and the Prometheus and Grafana stack alongside it.
The latest bundle is in the Release notes section at the bottom of the page.
Prerequisites#
- A Prometheus deployment with scrape configs pointed at the BSR pods.
- A Grafana deployment that uses Prometheus as a data source.
- A BSR version that meets the minimum listed for the bundle you’re installing (see Release notes).
Download#
Each release ships as a single zip containing the rule files and dashboard JSON:
- Latest release zip (link in the most recent release-notes entry).
What’s included#
Prometheus rules#
Three Prometheus rule files cover alerting and recording rules:
prometheus-slo-rpc-rules.yaml: rules for every BSR RPC endpoint.prometheus-slo-http-rules.yaml: rules for every BSR HTTP endpoint.prometheus-slo-registry-rules.yaml: rules for the language-registry endpoints that serve generated SDKs.
Grafana dashboards#
Three Grafana dashboards visualize the metrics produced by the Prometheus recording rules:
grafana-slo-rpc-dashboard.json: RPC traffic, with grouping bycluster,rpc_service, andrpc_method.grafana-slo-http-dashboard.json: HTTP traffic, with grouping bycluster.grafana-slo-registry-dashboard.json: language-registry endpoints serving generated SDKs.
The dashboards depend on the Prometheus recording rules above; without them, several panels won’t have data.
Install#
Load Prometheus rules#
Mount the three rule files into your Prometheus deployment and reload Prometheus. The exact mechanics depend on how your Prometheus is deployed (raw YAML, Operator, Helm chart); see Configuring rules for the configuration shape.
Import Grafana dashboards#
Import each dashboard JSON file through Grafana’s dashboard-import flow; see Grafana’s instructions.
Dashboards#
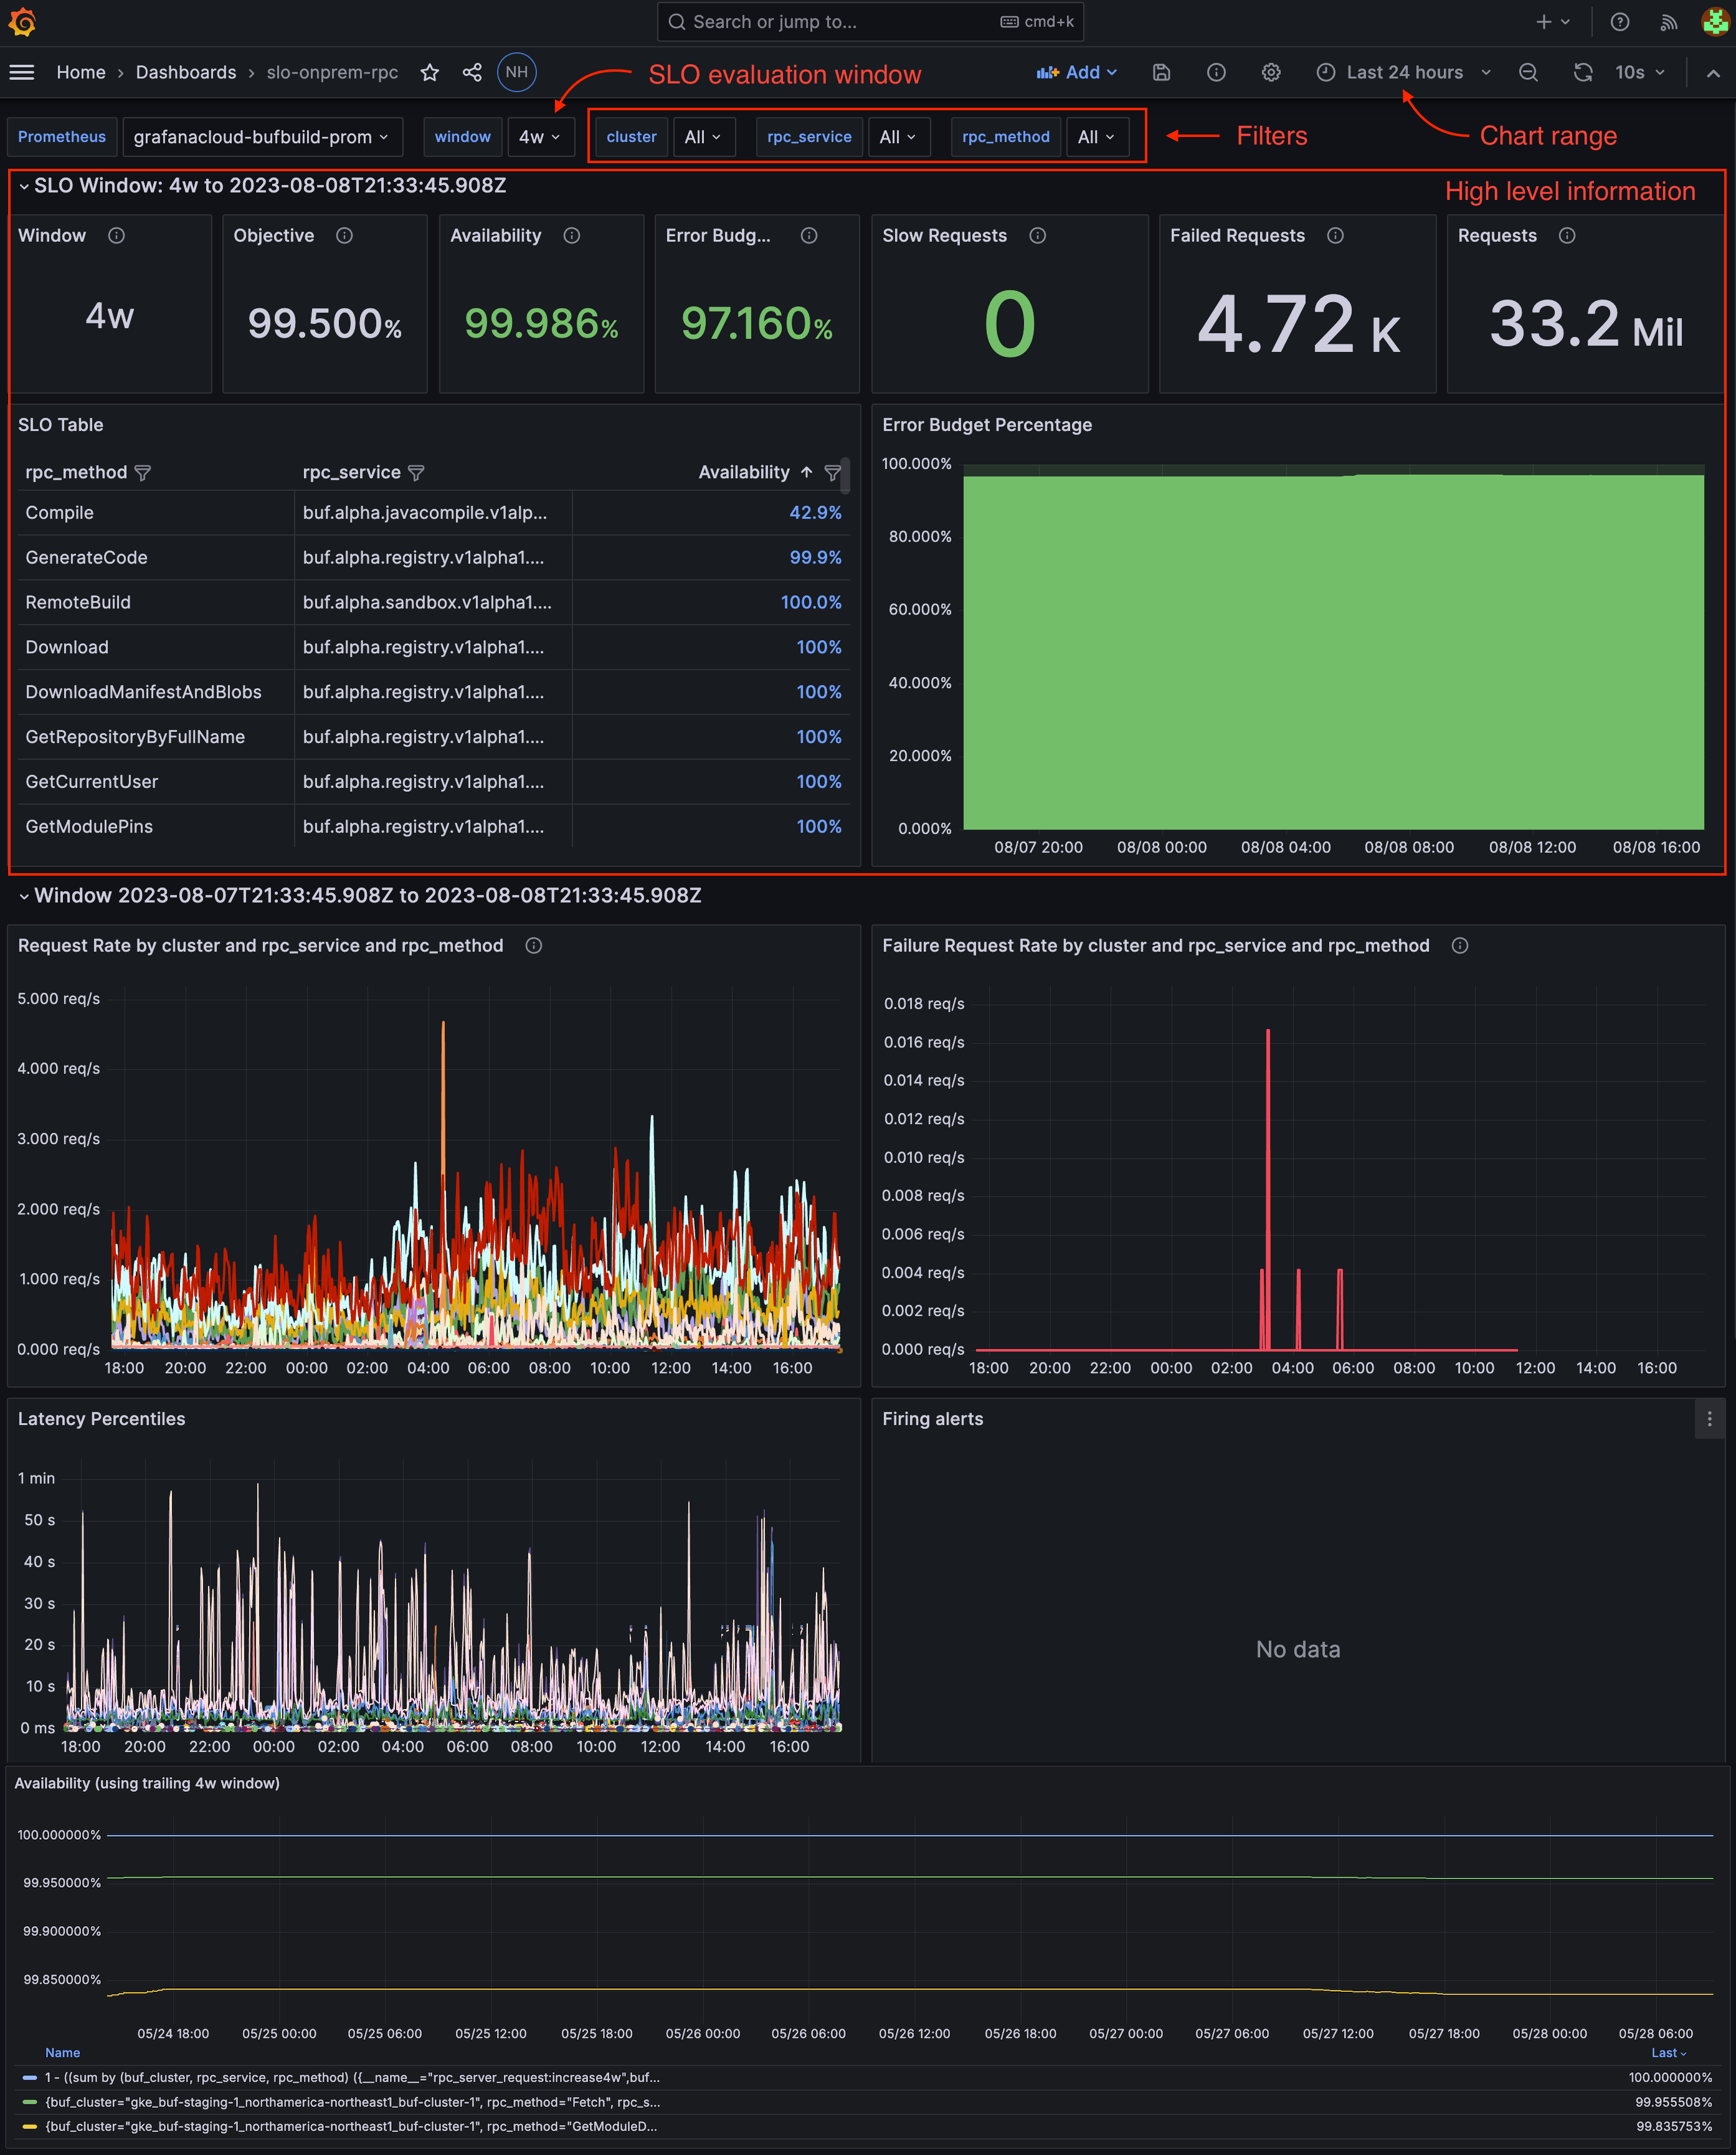
Each dashboard is built around a service level objective (SLO) for the traffic it covers.
Service level objectives#
The dashboards track availability and latency against fixed targets:
- Availability: 99.5% successful requests over a trailing four-week window. A request counts as failed if it returns a 5xx response (or the Connect equivalent) or if it exceeds its latency target.
- Latency:
| Dashboard | Latency target |
|---|---|
slo-http |
75s |
slo-registry |
75s |
slo-rpc |
10s for short-running RPCs; 75s for long-running RPCs |
Filters#
Filter the dashboards to scope the data they display:
| Dashboard | Filters |
|---|---|
slo-http |
cluster |
slo-rpc |
cluster, rpc_method, rpc_service |
slo-registry |
cluster, request_type |
request_type on the registry dashboard takes one of: maven, npm, go, swift, python, cargo, nuget, cmake, archive, or other.
The cluster filter is the one to set first when you run multiple BSR clusters under the same Prometheus.
Panel reference#
The first two rows of every dashboard summarize current state:
- Availability box, Error Budget box, Slow Requests box, Failed Requests box, Requests box: aggregate counts over the trailing SLO evaluation window.
- SLO table: per-grouping availability, lowest first so the dashboard surfaces problem areas at the top.
- Error budget percentage: aggregate error-budget burn-down over time, scoped by the active filters.
Three panels handle alerts and reference data:
- Firing alerts: any active alerts.
- Config: SLO numbers the dashboard is using. The values are baked into the dashboard JSON.
- Availability: instance availability based on 5xx responses over the trailing four-week window.
The remaining panels carry self-explanatory titles describing the underlying metric.
Alerts#
Alerts fire per grouping and per cluster against the 99.5% / four-week availability SLO. The two ErrorBudgetBurn alerts use different severities and burn-rate windows:
- High priority (
severity=page): fires when 50% of the error budget is consumed in the last hour and the grouping received at least 10 requests in that period. - Low priority (
severity=warning): fires when 10% of the error budget is consumed in the last 24 hours and the grouping received at least 10 requests in that period.
Route the labels to your paging or notification system according to your incident policy.
Triage#
Each alert carries labels identifying the cluster and the affected request grouping (rpc_service and rpc_method for RPC dashboards, request_type for registry-style dashboards; HTTP-dashboard alerts don’t carry RPC labels). Use the labels to:
- Open Firing alerts in the dashboard for the firing alert.
- Look at the error-rate diagram for spikes that line up with the alert’s onset.
- Apply the alert’s labels as filters in the dashboard to narrow the view to the affected grouping.
Status page#
The BSR exposes a status page at https://<host>/-/status for BSR admins.
The same page is reachable on port 3003 of every bufd pod without authentication, at http://<bufd pod ip>:3003/-/status.
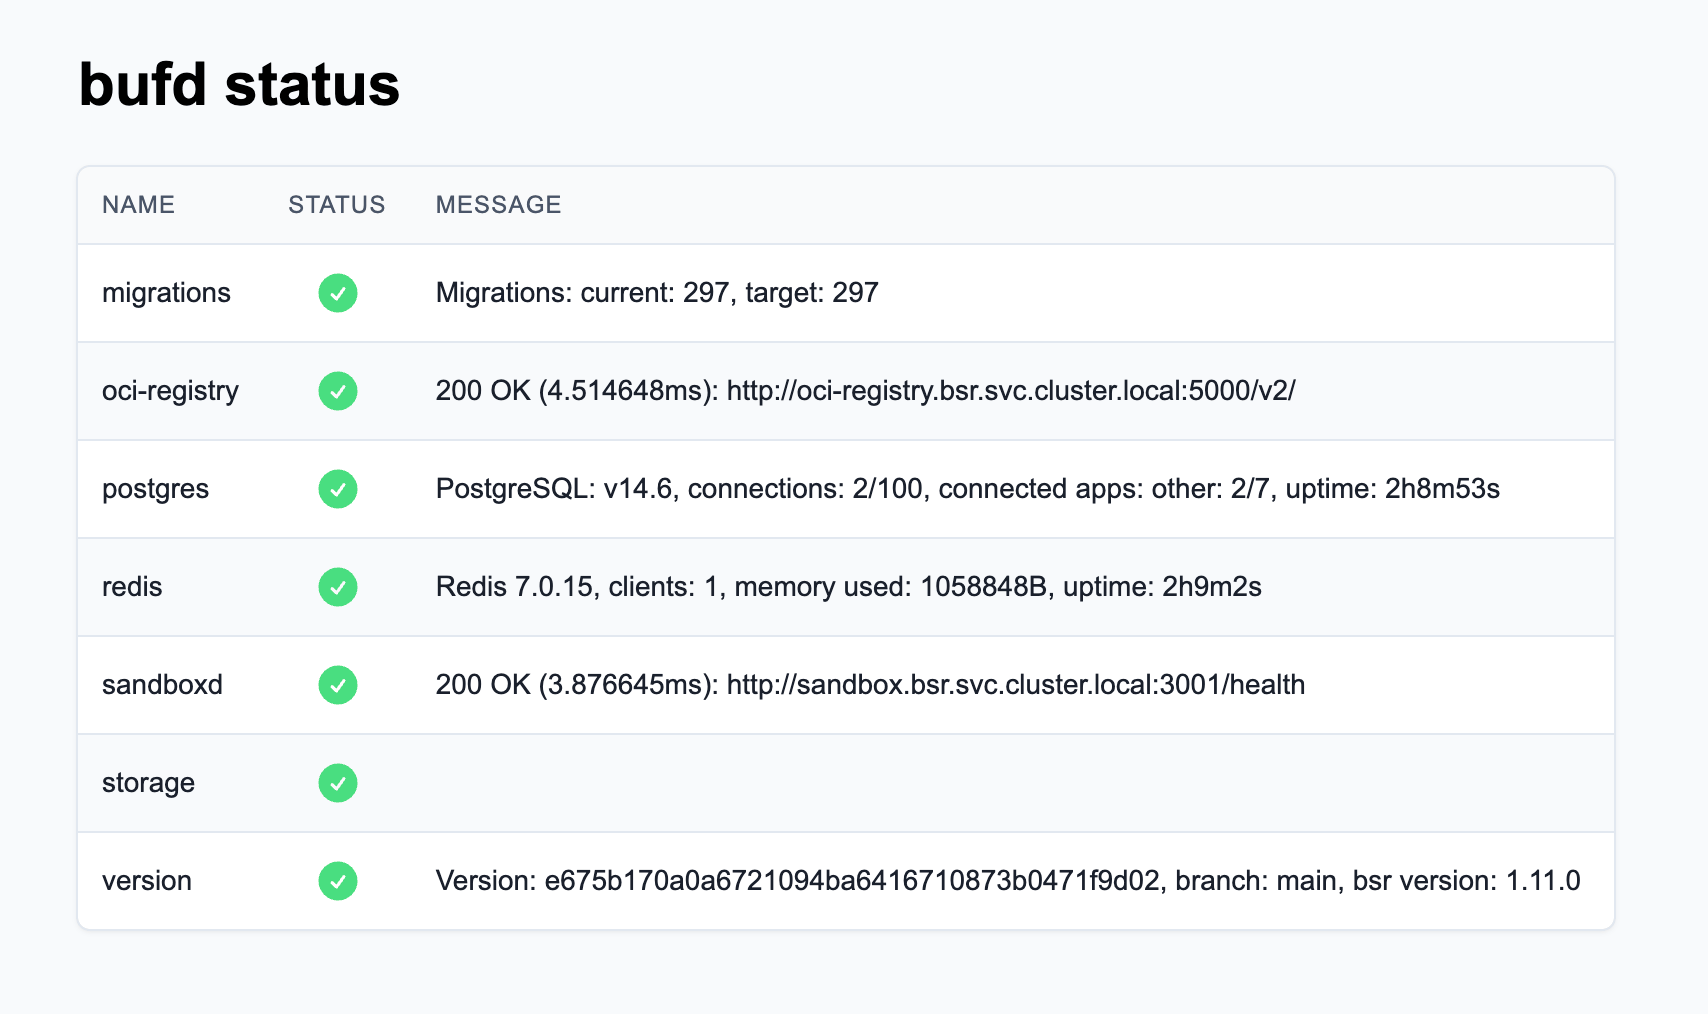
Each row reports the health of one subsystem (database migrations, OCI registry, PostgreSQL, Redis, sandbox, blob storage, BSR version). The page also serves the same data as JSON at /-/status/json:
{
  "overall_status": "healthy",
  "results": [
    {
      "name": "migrations",
      "status": "healthy",
      "message": "Migrations: current: 297, target: 297"
    },
    {
      "name": "oci-registry",
      "status": "healthy",
      "message": "200 OK (3.201933ms): http://oci-registry.bsr.svc.cluster.local:5000/v2/"
    },
    {
      "name": "postgres",
      "status": "healthy",
      "message": "PostgreSQL: v14.6, connections: 3/100, connected apps: other: 3/8, uptime: 3h40m37s"
    },
    {
      "name": "redis",
      "status": "healthy",
      "message": "Redis 7.0.15, clients: 2, memory used: 1061120B, uptime: 3h40m47s"
    },
    {
      "name": "sandboxd",
      "status": "healthy",
      "message": "200 OK (3.335016ms): http://sandbox.bsr.svc.cluster.local:3001/health"
    },
    {
      "name": "storage",
      "status": "healthy"
    },
    {
      "name": "version",
      "status": "healthy",
      "message": "Version: e675b170a0a6721094ba6416710873b0471f9d02, branch: main, bsr version: 1.11.0"
    }
  ]
}
The JSON shape is suitable for piping into a check that runs against every BSR pod.
Release notes#
v1.4.1
Release date: 2026-07-08 | Minimum BSR version: v1.33.0
- The HTTP and registry SLO dashboards and alerts were updated to use the
http_server_requests_totalmetric name that the BSR emits.
Download v1.4.1 rules and dashboards
Expand to see previous releases
v1.4.0
Release date: 2024-04-14 | Minimum BSR version: v1.3.0
- An Availability (SLA) panel was added to each SLO dashboard.
Download v1.4.0 rules and dashboards
v1.3.1
Release date: 2024-03-19 | Minimum BSR version: v1.3.0
- The observability dashboards and alerts were updated to fix a bug where an incorrect histogram bucket was being used.
Download v1.3.1 rules and dashboards
v1.3.0
Release date: 2023-12-05 | Minimum BSR version: v1.3.0
- The SLO alerting threshold for slow requests was decreased from 250s to 75s, in an effort to be more responsive to slow requests. Histogram buckets for HTTP metrics were adjusted so they’re now in parity with RPC metrics.
Download v1.3.0 rules and dashboards
v1.2.0
Release date: 2023-10-03 | Minimum BSR version: v1.1.0
- Added new SLO dashboards for non-RPC endpoints to give visibility into the entire BSR as a whole. Separate dashboards now monitor all HTTP requests and registry requests.
Download v1.2.0 rules and dashboards
v1.1.0
Release date: 2023-08-28 | Minimum BSR version: v1.0.4
- Enabled alerting for SLO dashboard.
- Adds high-priority alerts with
severity=pagelabel for high-error-rate incidents (ErrorBudgetBurn). - Adds low-priority
ErrorBudgetBurnalerts withseverity=warninglabel for low-error-rate incidents.
Download v1.1.0 rules and dashboards
v1.0.0
Release date: 2023-07-14 | Minimum BSR version: v1.0.2
- Initial version of Grafana dashboards and Prometheus recording rules.